Monitoring of servers and services is always important in a homelab, especially if i’m out of town or just not active in my man cave working on projects and systems.
Concept of Operations (CONOP)
- install influxdb on docker(using portainer)
- configure the metric server on proxmox
- configure a dashboard (using Grafana)
Step 1
First thing is to install the influxdb on docker, i’m going to use portainer, portainer is a web-based UI for container technology, it works particularly well for docker installs and maintainece. Installing portainer is a seperate discussion and another blog post for another time. A quick google search will land many tutorials for portainer if you don’t want to wait on me to make a blog post.
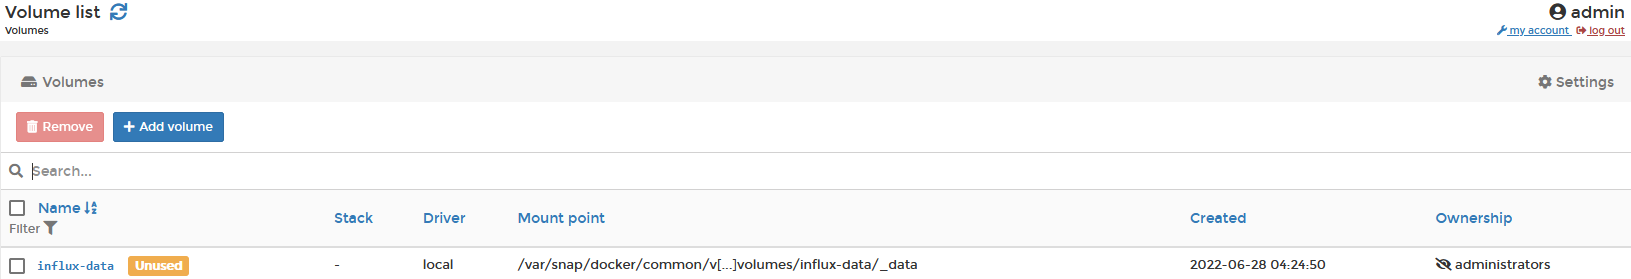
First thing, navigate to the volume tab in portainer and create a new volume. The volume will be assigned to the influx db for capturing persistent data.
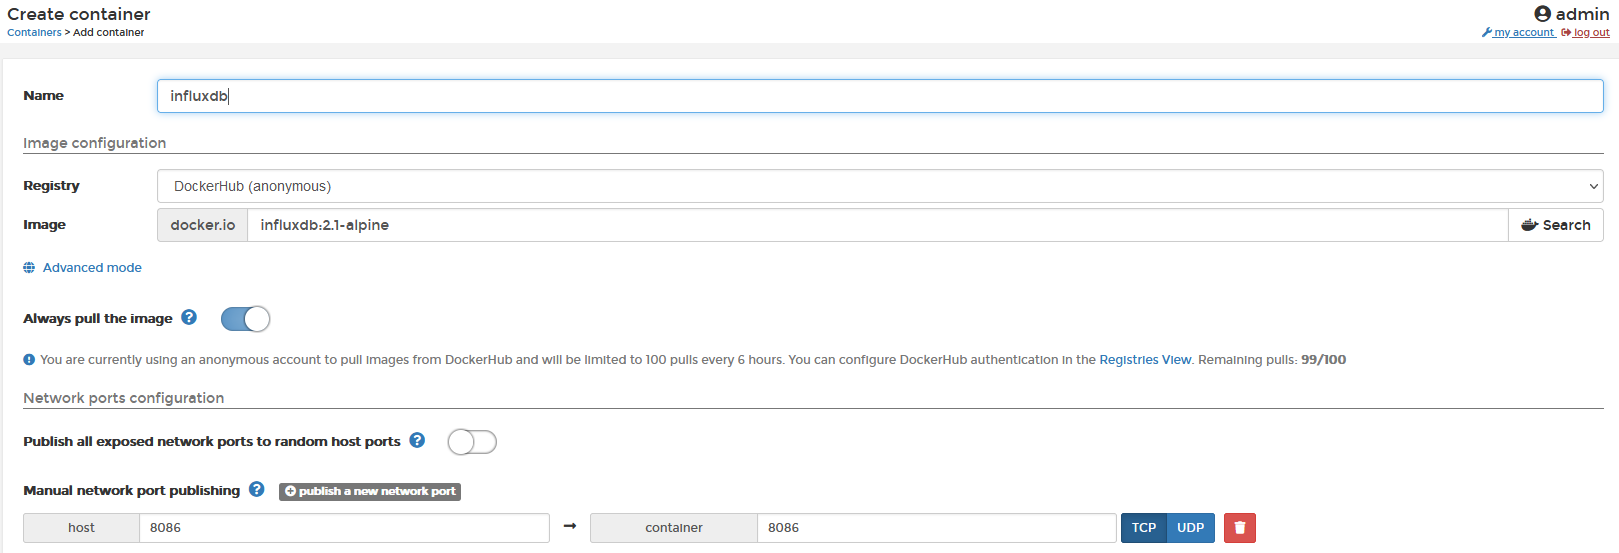
Next is creating a container in portainer, as seen below i’ve created a container named influxdb and we are pulling the image from DockerHub using the alpine distro and version 2.1. If you want to research version for infuxdb, navigate to docker hub influxdb and you will find the 2.1-alpine tag. One of the strengths of containers is if you want to experiment and test other containers with a different OS or versions, it’s a quick rebuild and standup a new container. Expose the port of 8086 in docker and the container.
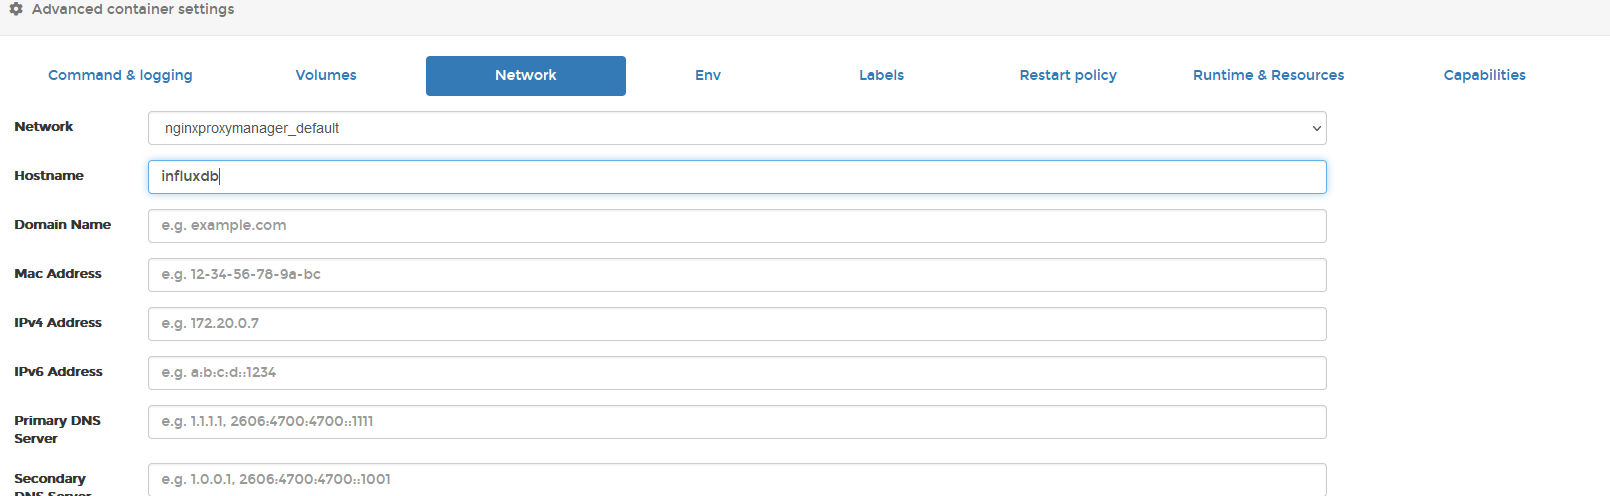
Now, the advanced options of portainer must be configured for this container, navigate to the network options and give the container a hostname and assign the container to a docker network. Both of these settings will be important later, both grafana and influxdb must reside in the same docker network. Setting the hostname will make it easier in allowing influxdb to query by the docker hostname and port number.
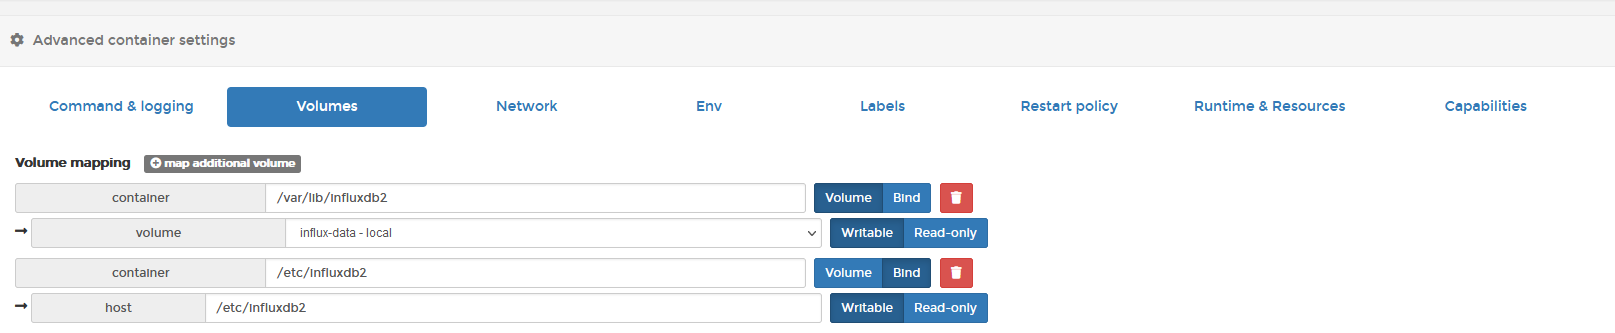
Now to persist the data collected, naviagate to the volume tab in portainer and setup two volumes, the volume created earlier will be first, connection the volume to the location /var/lib/influxdb2 in the container and bind mount a container to /etc/influxdb on both the host and container.
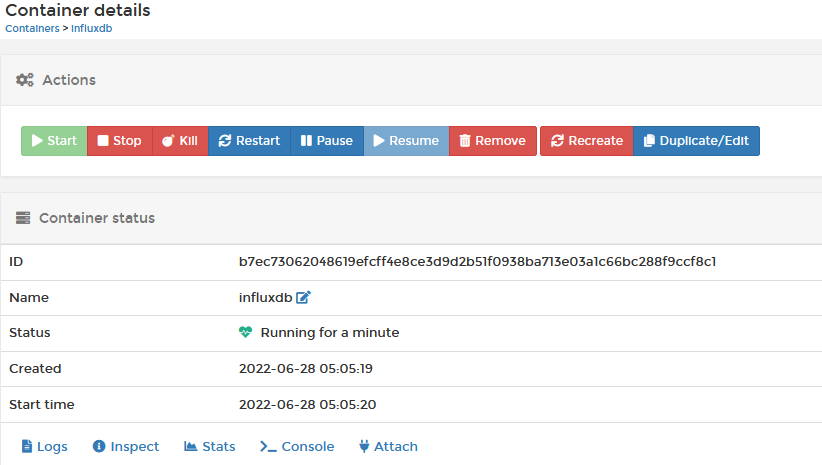
Now, deploy the container by clicking the ‘deploy container’ button and check the container to verify that the container is running, if the container isn’t running take a look at the docker logs for errors, the logs can be seen in the bottom corner of the sceenshot.
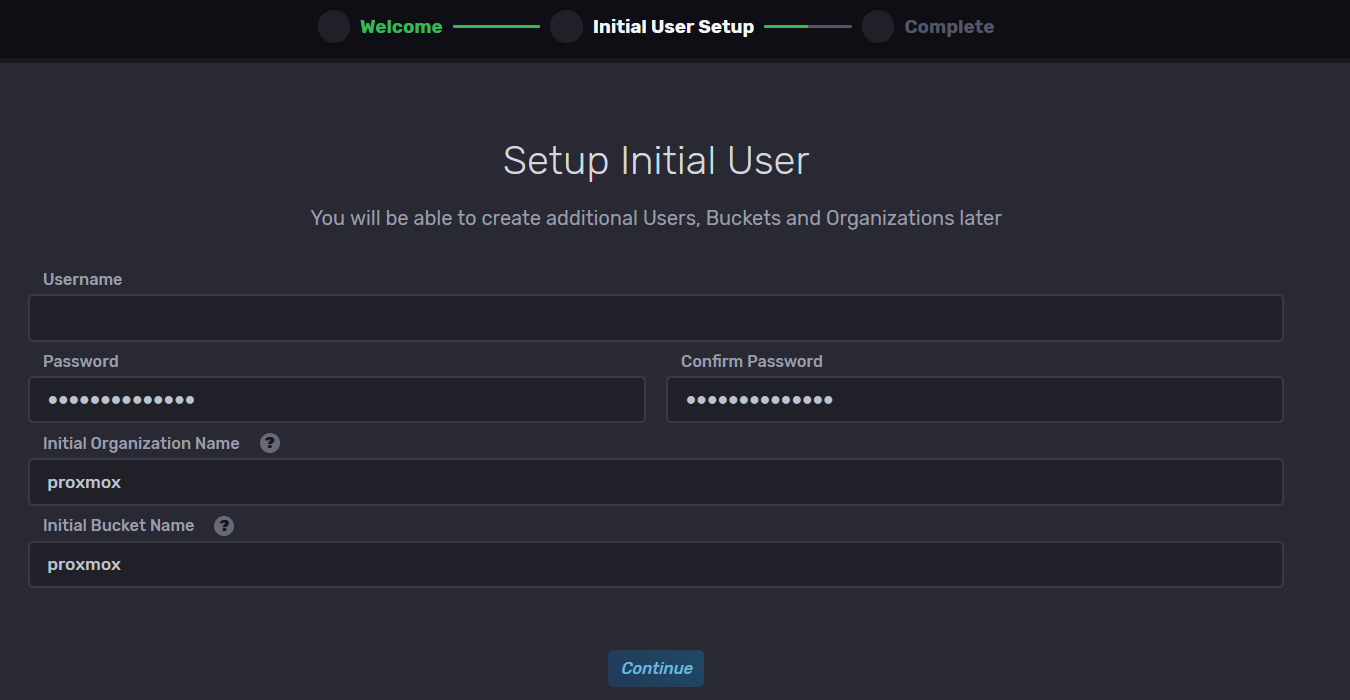
Now that the container is up and running, we’ll setup the influxdb account, created a username, password, bucket and a organization name (you can just make up a organization)
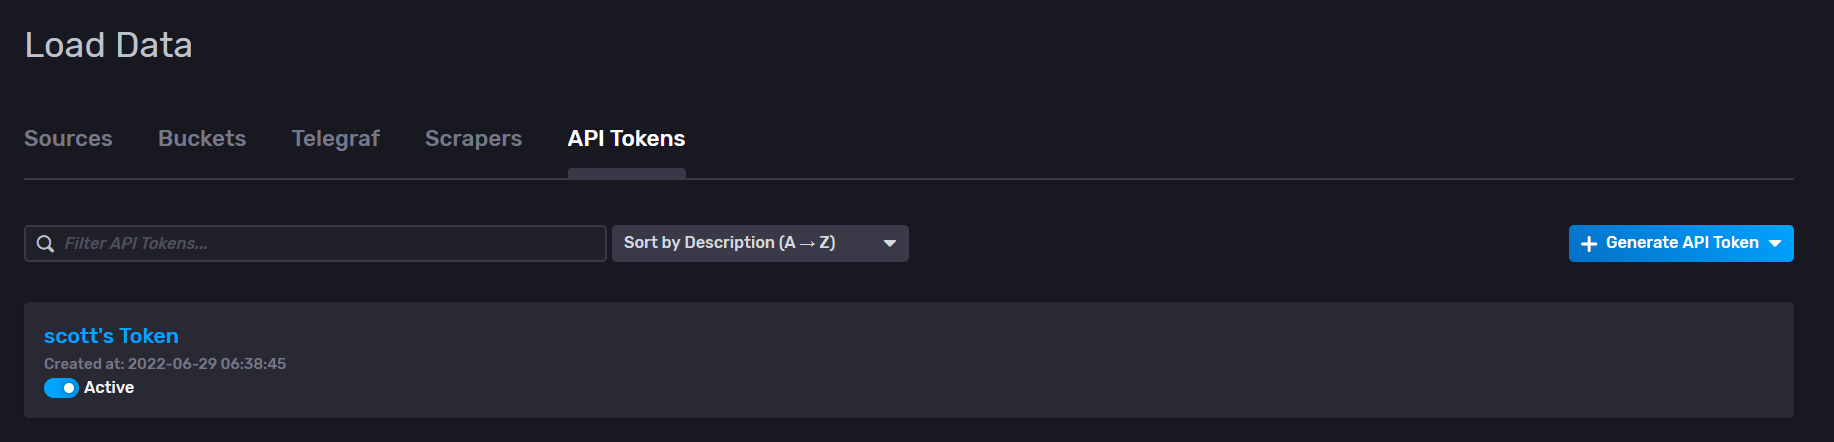
Next, you’ll want to get the API token for the account, this API token will be used in the next step with connecting the Proxmox metric server.
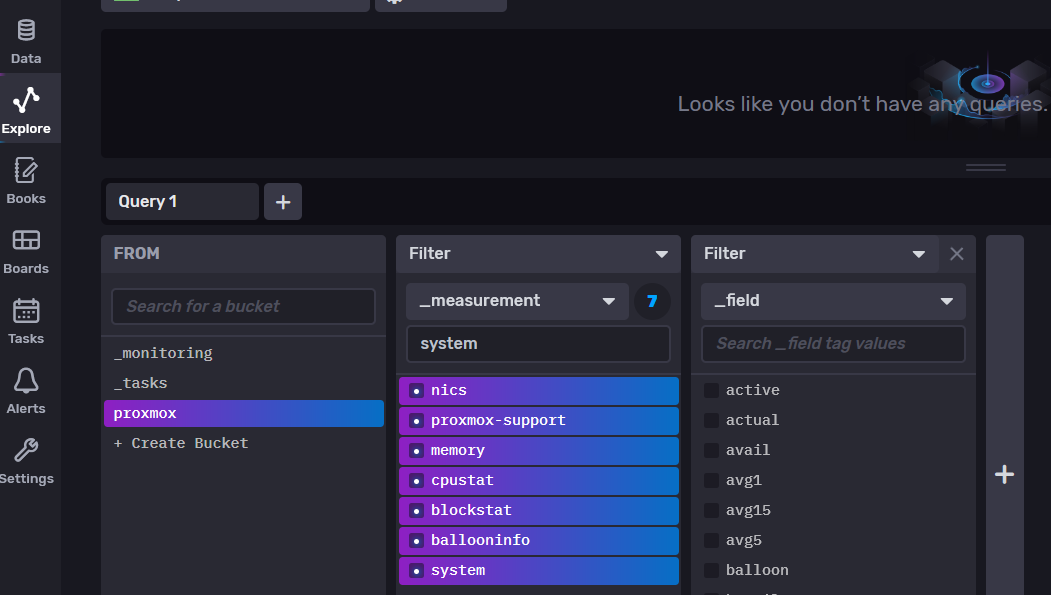
Before going to the next step, validate influxdb can pass data, setup a query and verify that data can be seen in the logs.
Step 2
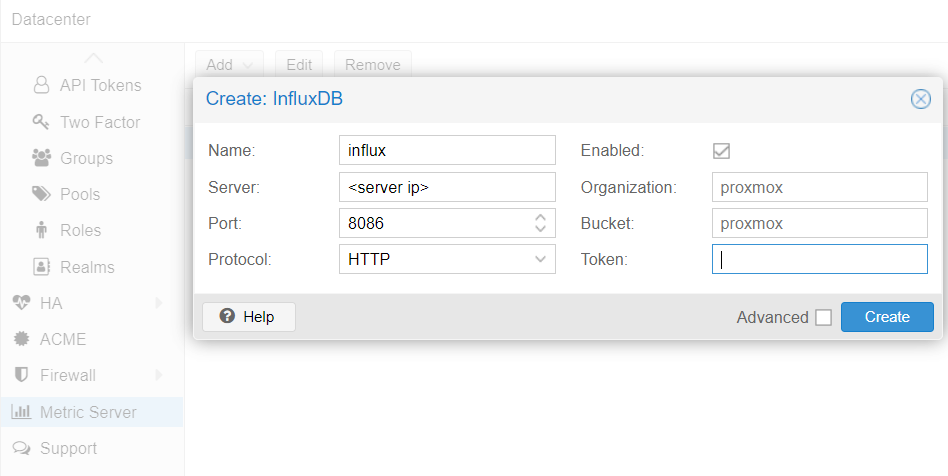
The next step is to navigate to your proxmox server and setup a metric server. Navigate to the DataCenter, scroll down to ‘Metric Server’ and add a new influxdb server. The settings below are the same settings used in step 1 to created the influxdb account.
Step 3
In step 1, we use portainer to deploy the influxdb docker container, for grafana, we are going to mix things up and deploy using a docker-compose YAML file.
I’ll break the code into smaller chunks and provide some narrative on each section, here is a link to the full code on my github and can skip this section if you are familar with docker-compose and how it utilizes YAML values
version: '3'

volumes:
  grafana-data:
    driver: local
The version with a value of 3 in the code above tells the Docker Daemon that the file will be compatible with a version 1.13.0 and above of the Docker Engine. The volume creates a grafana volume in docker and mounts the volume in the container at ‘/var/lib/grafana’, this is important for keeping persistent data if the container is removed or destroyed.
services:
  grafana:
    image: grafana/grafana-oss:latest
    container_name: grafana
    ports:
      - "3000:3000"
    volumes:
      - grafana-data:/var/lib/grafana
    restart: unless-stopped
The image above tells Docker to pull the latest open-source grafana image ‘grafana-oss’ from Docker Hub. Instead of using the tag ‘latest’ there are other options to use operating systems like Ubuntu, the latest tag defaults to the operating system of alpine. The ports are mapped from docker to the container on 3000 and the volume is mounted as discussed earlier.
networks:
  default:
    name: nginxproxymanager_default
    external: true
The networks section of this docker-compose is critical to get right, this section will tell Docker to install Grafana on a specific network under name. The network must be the same as the network that influxDB was installed on or else the to containers will not be able to communicate.
Now run the following command from the diretory of our docker-compose file
Verify your container is running with docker ps
Security, one important thing to point out is this configuration doesn’t include any inherent security features like SSL, the connections are insecure. Right now, i’m using a reverse proxy to secure the containers and the connection to proxmox on my internal network, in the future i’ll look at doing a updated posted to describe how to secure the connections between Proxmox, Influx and Grafana with SSL for a production environment. Right now, that is out of scope.
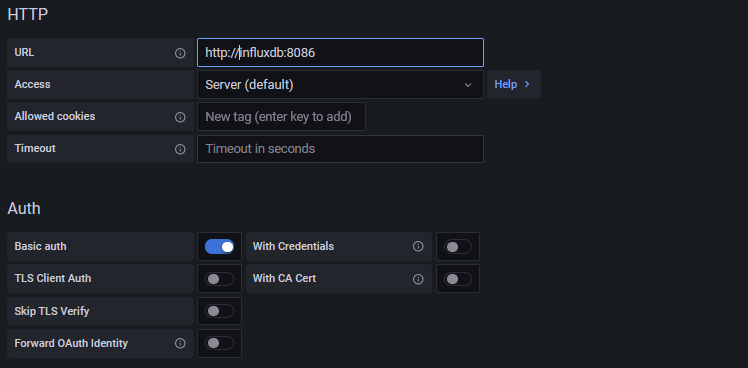
Once Grafana is installed, navigate to http://<ip address>:3000 and login with the default username/password of admin/admin. Once logged in navigate to configure > Datasource and install InfluxDB
Install the settings as follows, important, the hostname in the http setting is the docker hostname of your influxdb container
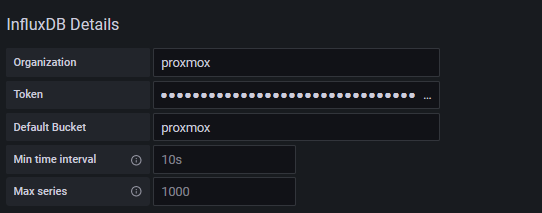
Set the influxdb bucket name, organization and API token that was previusly established with the influxdb container.
There is a really great dashboard for Proxmox at this link, you can create your own dashboard but this dashboard had everything that i wanted below.
[grafana dashboards]https://grafana.com/grafana/dashboards/15356
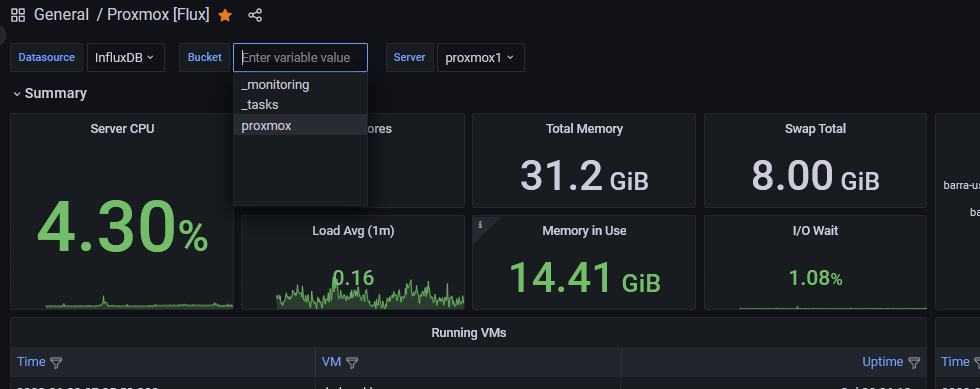
Now navigate to the dashboard you have created, my bucket defaulted to a different bucket, make sure you select the right bucket and enjoy your metrics!
Scott Powell
U.S. Army Officer specilizing in cybersecurity and IT Operations with 20+ years of experience, tech enthusiast with a passion for open-source, home lab and microservices


Comments